
Photovoltaic Configurator Design
Role
UX Designer
Duration
Mar – Jun 2023
Client
UX Fans for Centropol
The Šetří celé Česko website is an innovative initiative designed with consumers in mind, emerging from the challenges in the energy market that began in 2022. It addresses the pressing needs of everyday individuals seeking effective ways to reduce their household expenses. This platform offers valuable insights into money-saving strategies and highlights specific avenues for accessing state support. At its core, the site features a comprehensive suite of calculators and configurators, empowering users to assess and optimise the energy consumption of their most commonly used appliances, including electricity, gas, and heating. Additionally, one of the configurators is dedicated to helping users evaluate the financial benefits of investing in photovoltaic solar panels.
Photovoltaic solar panels currently represent a highly demanded solution based on sustainability and energy savings. Relatively high savings can be achieved due to the very high price of energy, which had to be capped by the government for 2023. As a result, people are considering investing in solar panels, but due to the complexity of PV, it is difficult for them to understand the economic benefits.
After conducting thorough research and compiling a detailed array of relevant data, I have crafted an innovative PV configurator. This tool aims to deliver a tailored, all-encompassing, and easily digestible overview of information focused on return on investment for specific configurations. It also visualises electricity consumption derived from photovoltaic energy, while offering the option to sell any excess back to the grid.
01/ The Product
Data input & Overview
The first section of our configurator offers essential inputs to calculate subsidies, electricity costs, and photovoltaic setups based on your energy use. Once you enter this information, the tool generates a customised solution that you can adjust to your liking. It then provides clear figures to help you evaluate the financial benefits of investing in solar energy, empowering you to explore different scenarios and understand how your choices can influence savings and returns.
- Subsidy amount for the given configuration
- Annual Electricity Savings
- FInal price for the given configuration
- Surplus sale value
- Return on investment time period
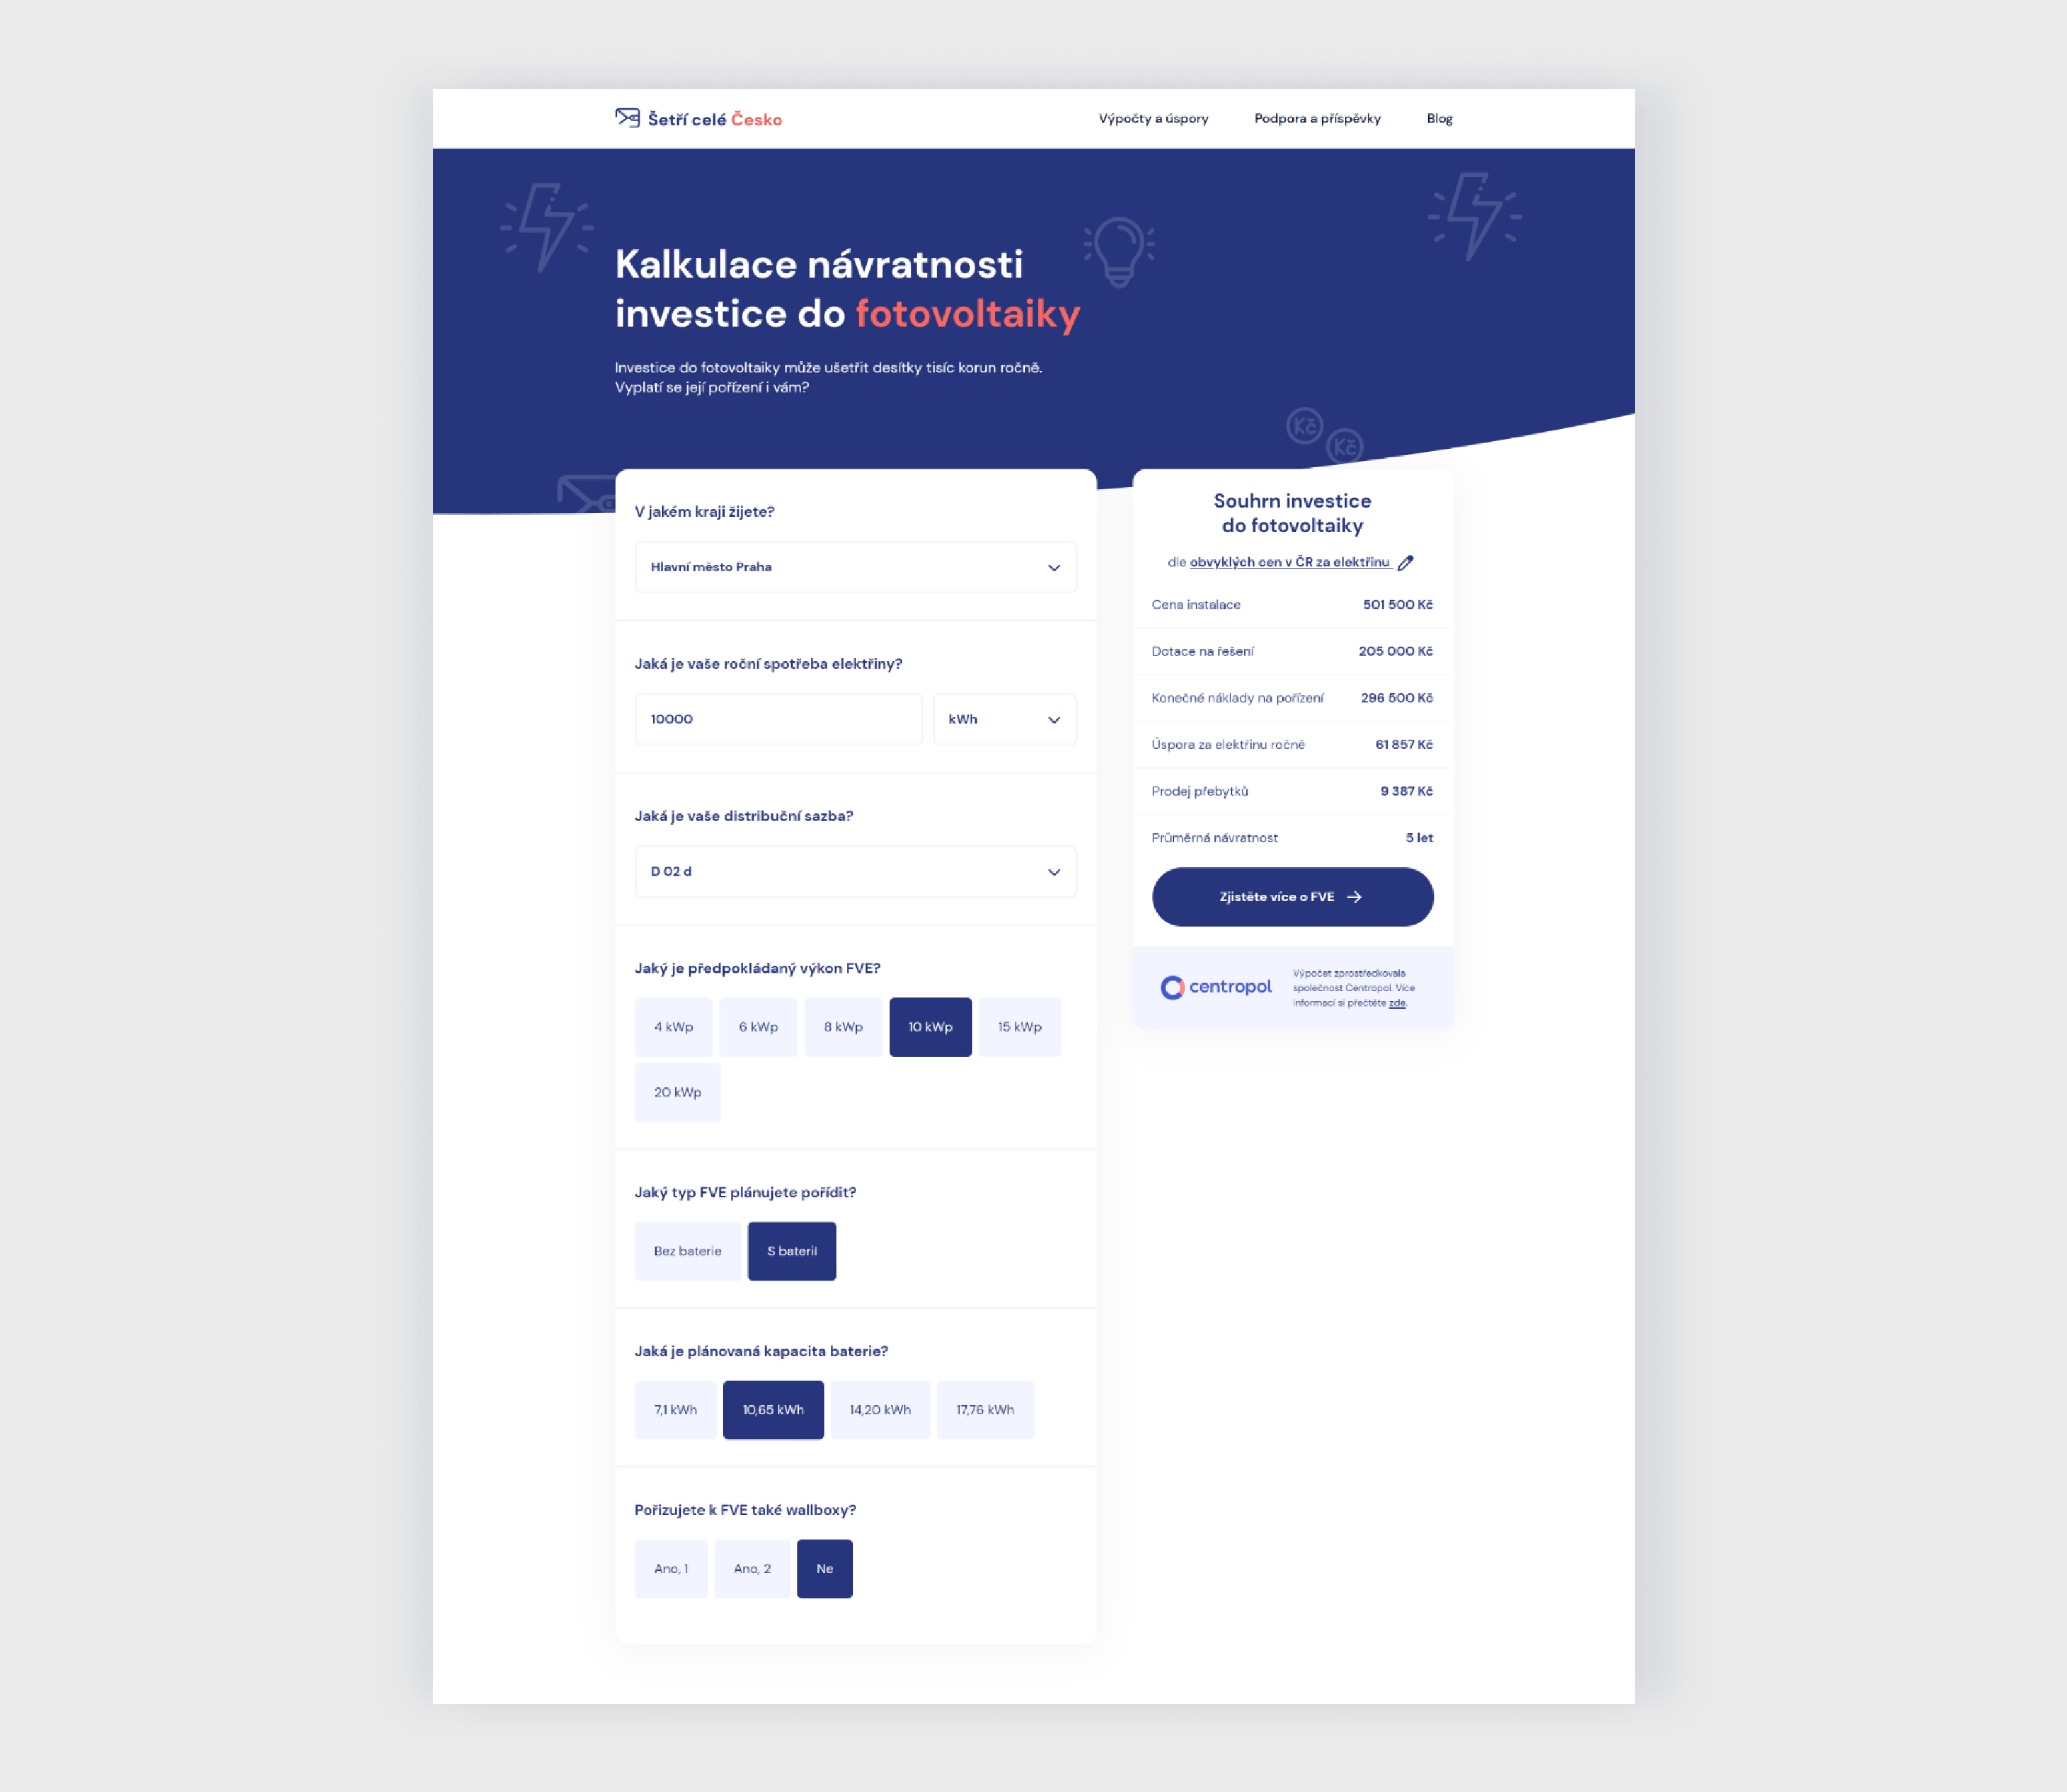
Image: Innovative calculator for solar energy investment planning
Visualization of Electricity Consuption
The second section of the configurator presents a dynamic graph that illustrates energy consumption throughout the year. This graph features a curve that represents energy generated from photovoltaic sources alongside energy that must be purchased, highlighted in red and orange. Additionally, it showcases the sale of surplus energy back to the grid, depicted in green. The purpose of this visualisation is to demonstrate how effectively solar panels can meet household energy needs while also highlighting the potential for selling excess electricity, which is feasible only during specific months of the year.
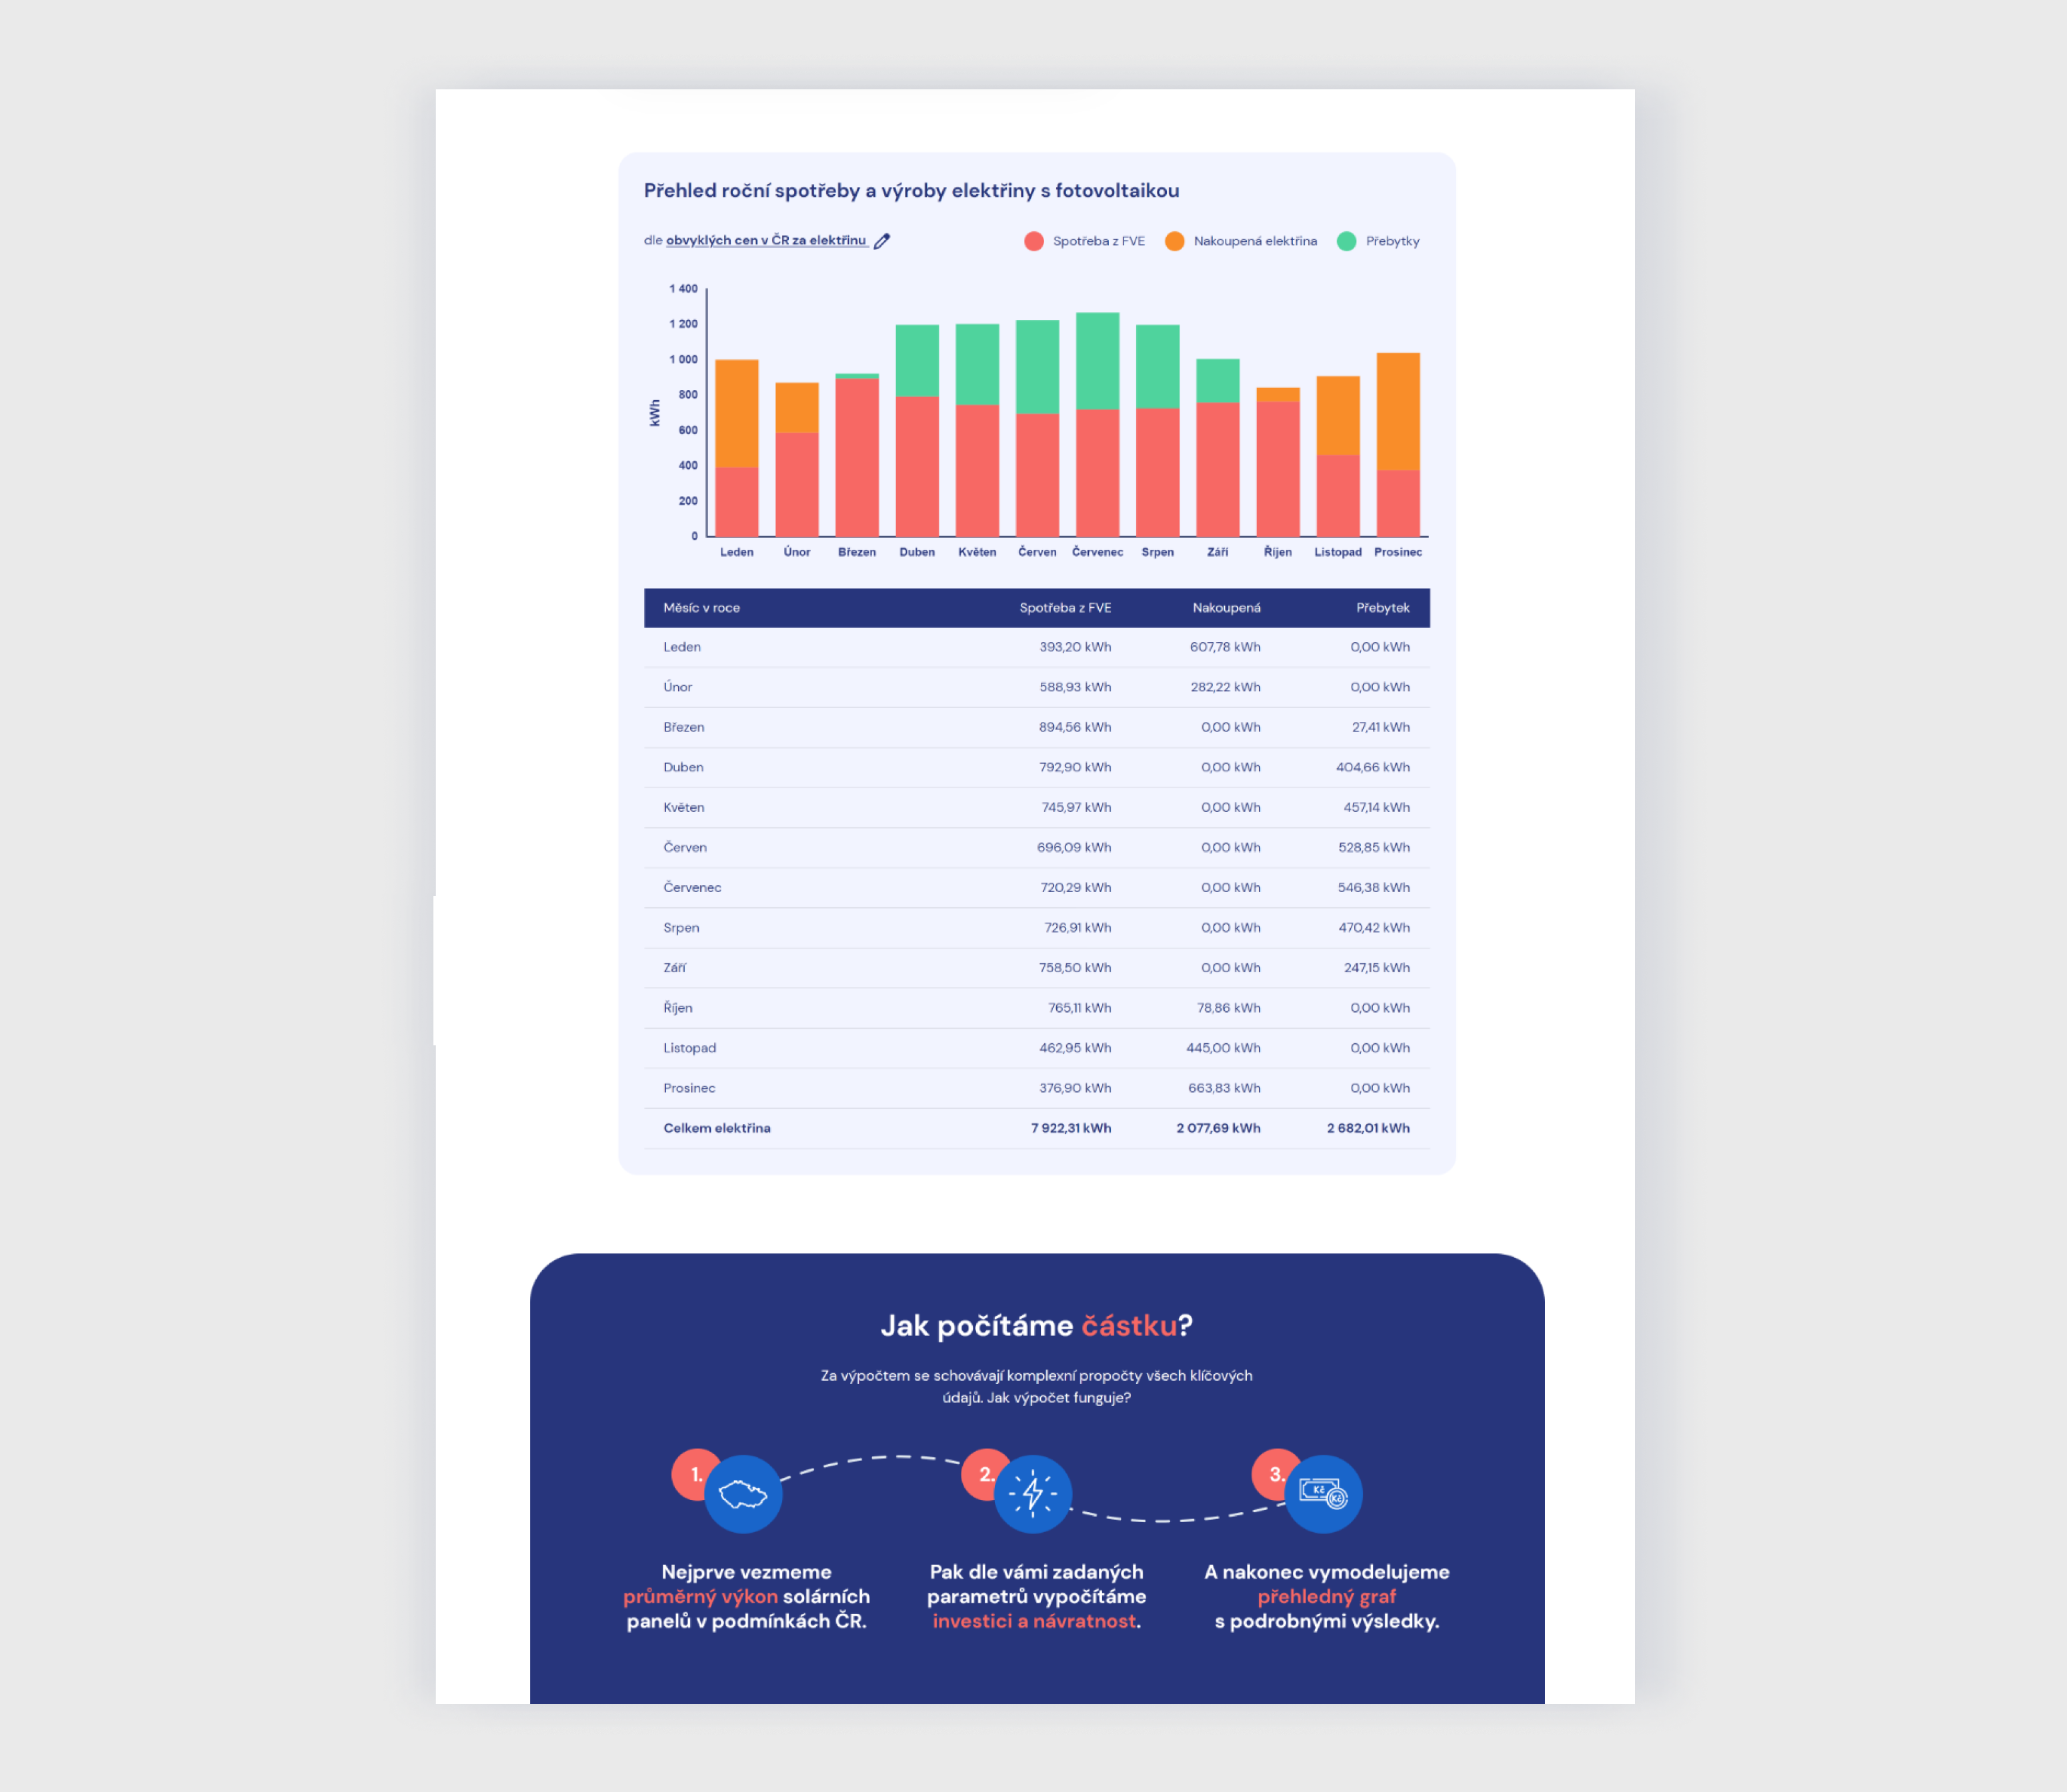
Image: Interactive graph visualization
Explanation of the calculation
The product comes with an overview of the calculations involved. Given the intricate nature of the problem, we’ve simplified the information and clearly outlined our assumptions, ensuring the user would be able to gain a thorough understanding of the process.
Related blog concept
An additional part of the configurator was a blog articles section, the structure of which I designed to give further information that could not be included in the configurator due to its simplification. The article contains an explanation of PV, its advantages and limitations, and recommendations for users who decide to invest in PV, such as how to choose a reliable supplier for PV and other useful information.
02/ Key Takeaways & What I learned
Understanding of PV
In order to design the comprehensive configurator, I had to study in detail how PV works, how subsidies are calculated and figure out how to combine the information into one easy to understand place.
Preparation of complex data for developers
In the course of the project, I developed an extensive guide that demystifies the intricate calculations for developers, streamlining the configurator development process. I crafted detailed Excel spreadsheets to illustrate all the formulas and scenarios, providing a clear understanding of the underlying mechanics.
Proposing a simple solution to a very complex problem
Utilising a comprehensive dataset that I carefully examined in Excel, I aimed to craft a way to present information that is not only straightforward but also engaging, understandable and useful for users.